To be able to make smart decisions about your supply chain, you have to look at the availability of the different oil ingredients you may use. I thought today would be interesting to take a look at the data on which oils have the highest global production, and see which have gone up and which have gone down over time.
The USDA Foreign Agriculture Service provides an online tool which allows us to track the availability of different oils within a particular country or around the world. You can see information like total supply, imports, exports, production, crush, etc.
Analyzing this information allows us to glean some data and make smart decisions about future oil purchases. When you’re looking at this data, you can ask questions like:
Is supply of your particular oil going steadily down? If so, why? Is it affecting prices?
Which oils have the most supply? Should you lean towards those if you need very high volumes or guaranteed supply?
Which oils have the least supply? Can you work with your supplier(s) to mitigate risk and secure a long term supply chain? Will your prices be affected? Can your company absorb any price changes down the road?
USDA FAS Data On Edible Oil Global Supply 2005-2015
Using this data from the USDA, I’ve created a number of charts below. They review the total supply of all of the commodity oils compared to one another, as well as the total global supply of each different oil.
To understand these supply numbers, keep in mind that they are based on units of 1000 metric tons — therefore, in 2005, the total global supply for coconut oil was 5,846,000 Metric Tons or 12,888,091,600 pounds (2204.6 lbs per metric ton).
Another good way of thinking about it is in totes -- a metric ton is approximately one tote.
Summary: Global Edible Oil Supply From 2005-2015
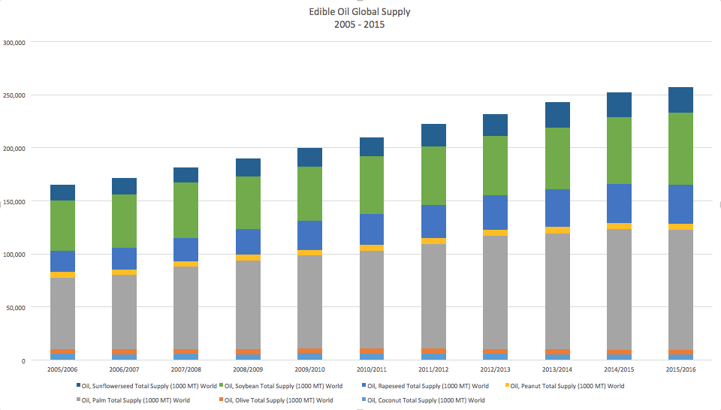
This chart shows the total amount of oil produced in the world. Overall, it's going up -- we're planting, growing and producing more oils now than we were in 2005.
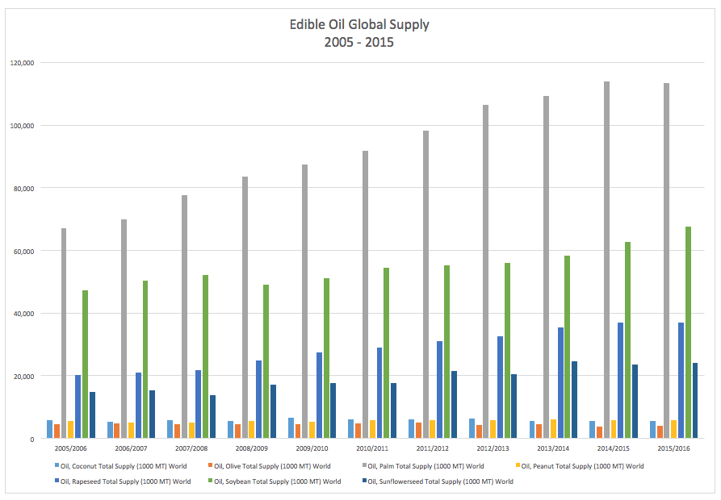
This chart allows you to visualize the vast difference in volumes between the different types of oils being produced. As you can see, palm oil is produced in vastly higher numbers than coconut, olive, peanut, sunflower or even canola oil.
Palm oil and soybean oil really take the cake in terms of total volume production. In fact, the total supply of olive, coconut, peanut, sunflower and canola put together don't even equal half of the palm and soybean volume put together.
Highest Edible Oil Supply Volume In 2015
This list below shows a breakdown of the number comparisons between oils that you can see above in the total supply chart above. These oil volume comparisons are only based off the last year.
- Palm Oil: 113,480,000 MT
- Soybean Oil: 67,648,000 MT
- Canola Oil: 36,989,000 MT
- Sunflower Oil: 24,096,000 MT
- Peanut Oil: 5,749,000 MT
- Coconut Oil: 5,474,000 MT
- Olive Oil: 3,923,000 MT
Greatest Increase in Volume
Which oils saw the greatest increase in production between 2005-2015? Which crops were planted more and saw an increase in demand? Here's the percentage of change between their 2005 volumes to their 2015 volumes.
- Canola Oil: +83%
- Palm Oil: +69%
- Sunflower Oil: +62%
- Soybean Oil: +43%
- Peanut Oil: +4%
Greatest Decrease in Volume
On the flip side, which oils saw a decrease in volume and experienced supply chain issues or a slowing availability of oil? Olive oil and coconut oil.
- Olive Oil: -15%
- Coconut Oil: -6%
Comparing The Evolution Of Supply Availability For Each Type Of Oil
Palm Oil: Total World Supply 2005-2015
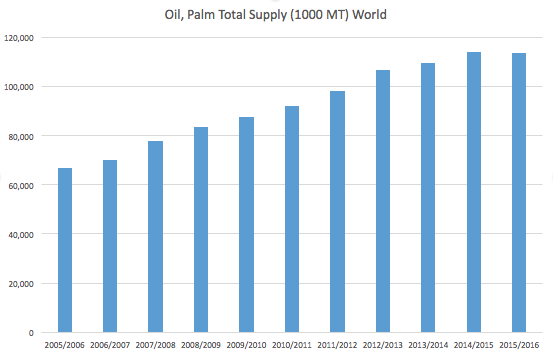
Palm oil global supply grew by 69% over the 10 year period.
Olive Oil: Total World Supply 2005-2015
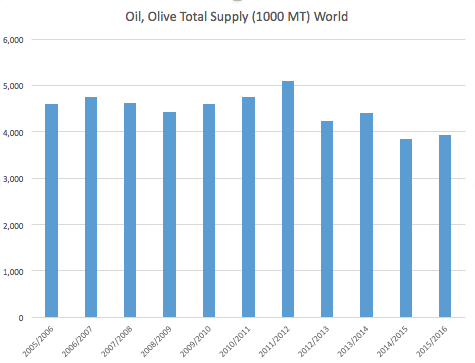
Olive oil saw the largest decline compared to the other oils, particularly in the last few years. This global supply declined by 15% over the last 10 years.
Soybean Oil: Total World Supply 2005-2015
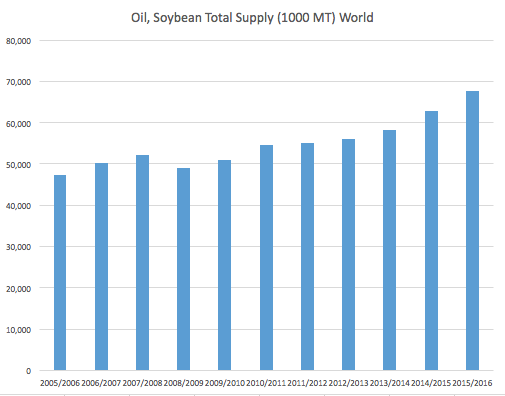
Soybean Oil total supply grew by 43%.
Canola Oil: Total World Supply 2005-2015
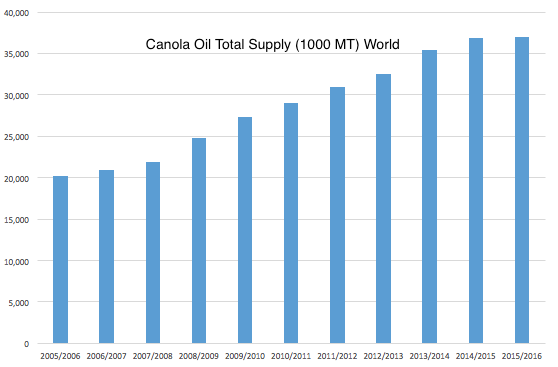
Canola Oil global production grew by the largest amount in comparison to all of the oils, with a total growth of 83%.
Sunflower Oil: Total World Supply 2005-2015
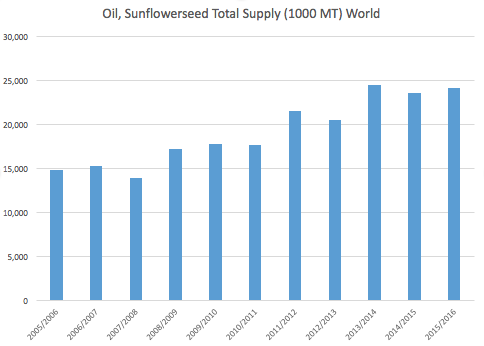
Sunflower Oil global availability of supply grew by 62% over the 10 year period.
Coconut Oil: Total World Supply 2005-2015
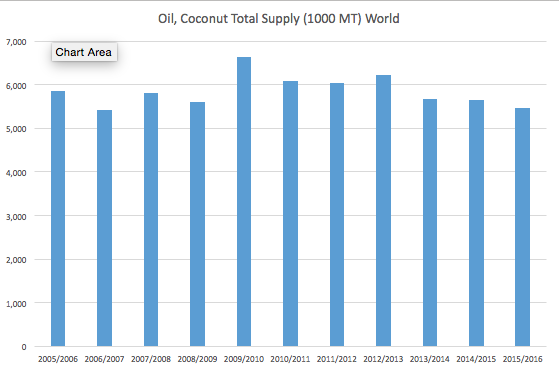
Coconut oil also saw a decline in global supply, but smaller than olive oil -- declining by 6% over the 10 year period (as you can see from the ups and downs, however, it remains reasonably steady looking at this smaller 10 year period).
If you want to learn more about coconut oil supply and hear a commodity market update, you can read, Supply and Demand in the Coconut Oil Market [MARKET UPDATE].
Topics: Harvest/Commodity Market